Overdosing on Supplements: A case of Hyperthyroidism
In December 2020, I had a prospective patient call my office to inquire if I could help him with a new diagnosed case of hyperthyroidism. He was a 58 year old male who had been to a few physicians and specialists before calling my office. He had seen his regular primary care physician, a cardiologist and was referred to an endocrine specialist. He said that his cardiologist laid into him for having low thyroid scores, an indication that he was hyperthyroid and he needed to take thyroid medication to stop this. He was being prescribed thyroid medication and did not want to take medication and experience side effects. That is when he started searching for natural endocrinology options and came across my practice, Natural Endocrinology Specialists, PLLC. He understood that I did not accept insurance and it was going to be an out of pocket expense but he decided to make a health investment and came in for his first appointment in mid January 2021.
1
Visit 1
Mid January 2021
Visit 1
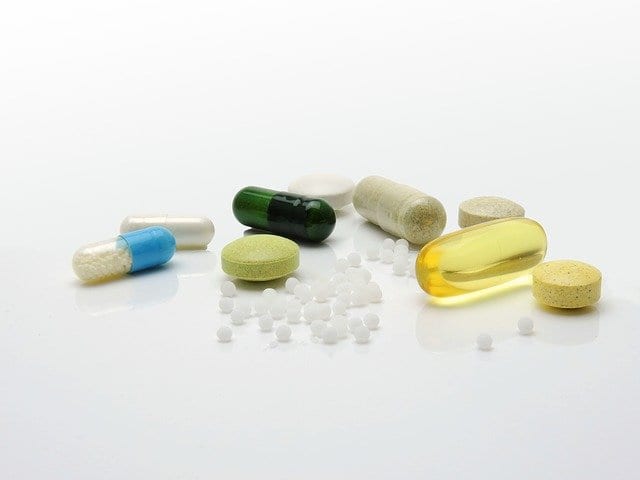
At this first appointment, we discussed his past medical history, allergies, medications, supplements and past lab work. I acknowledged that he was taking NUMEROUS supplements (11 to be exact) that were recommended by a chiropractor. He assumed that all of these supplements were necessary and presumed to believe that they were helping his health. His initial lab work from 12/2/2020 showed the following TSH score of 0.01. His other thyroid markers were not tested, including thyroid antibodies to see if he had either or both Hashimoto's thyroiditis or Graves disease. He also did not have any thyroid imaging studies done.
1234
2
Visit 2
Late January 2021
Visit 2
During the second consultation, the information was reviewed. The second lab work again showed a TSH score of 0.01 again. The treatment plan after this visit was the following:
123
3
Visit 3
Late February 2021
Visit 3
He returned to the office for consultation 3 on 2/24/2021 and his lab work showed that he was negative for autoimmune thyroid conditions such as Hashimoto's, Graves and his TSH score increased back to normal at 2.64. This was all accomplished by AVOIDING supplements and not overconsuming unnecessary minerals, vitamins that can affect thyroid function. The specific culprit in this case most likely is attributed to excess iodine intake.
Important Note
Important Note
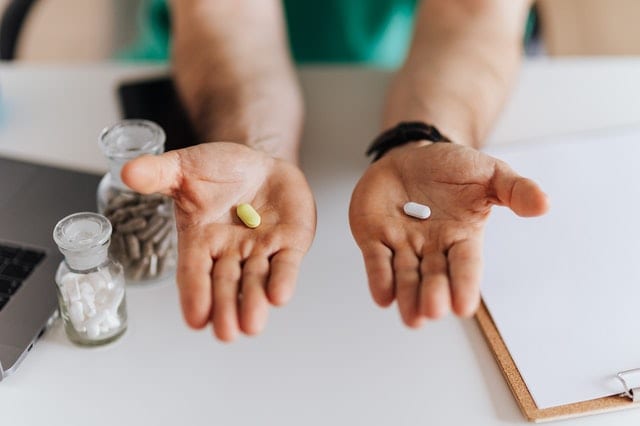
The WHO (World Health Organization) recommendations for Iodine are 150mcg daily. The thyroid gland only needs 52mcg daily to produce T4. Our general population does not need to supplement much more of this mineral to support thyroid health. There are many multivitamins and other supplements that contain high levels of Iodine and this can actually interfere with your natural thyroid hormone production.
Case Studies🔍
Case Study 1: Hashimoto's Thyroiditis Management
A 30-year-old female with Hashimoto’s faces fatigue, weight challenges, and other symptoms. Over 12 years, our holistic treatment, including medication adjustments and dietary advice, led to stabilized thyroid levels, improved menstrual health, and enhanced overall well-being.
Case Study 2: Hyperthyroidism & H. Pylori Treatment
A 51-year-old male, with a complex medical history including hyperthyroidism, received our comprehensive care. Tailored treatments including anti-thyroid medication adjustments and holistic measures improved energy, appetite, and led to the remission of thyroid antibodies.
Case Study 3: Natural Management of Type II Diabetes
A 68-year-old female struggling with diabetes and reacting to Metformin found relief through our care. Customized medication, dietary changes, and holistic practices significantly controlled her blood sugar levels, reduced thirst and urination frequency, and improved vision and energy levels.
Monitoring Thyroid Levels — Hypo or Hyperthyroidism
TSH Optimization
This TSH chart shows continued stability within optimal range (~0.6–0.9), indicating well-managed thyroid function over time with consistent care.
TSH Optimization
This graph shows successful TSH optimization in a hypothyroid patient, dropping from 25.6 to a stable 3.7 over 8 months.
Hypothyroid Stabilization
This graph illustrates TSH levels dropping from 8.51 to 3.18, showing clear improvement and stabilization of hypothyroidism through targeted intervention.
Hyperthyroid TSH Stablizaiton
This TSH High Sensitivity chart shows initial hyperthyroidism (TSH near 0), followed by a return to optimal range (1.6–3.1)—indicating successful stabilization of thyroid over time.
Thyroid Autoimmunity (TPO, TgAb, TSI, TRAb)
Hashimoto’s, Graves’, and Autoimmune Thyroid Markers
TPO Antibodies
TPO Antibody Trend
This graph shows a significant reduction in thyroglobulin antibodies from 95.2 to 6.1, reflecting improved autoimmune thyroid status.
TPO Optimization
This chart shows Microsomal TPO antibodies decreasing from 416 to 165, a strong indicator of reduced thyroid autoimmunity and Hashimoto’s improvement over time.
TPO Reduction
This Microsomal TPO Antibody chart shows a substantial reduction from 755 to 193, highlighting effective lowering of thyroid autoimmunity through supportive care.
TPO Reduction Example
This Anti-TPO antibody chart shows a remarkable drop from 1,091 to 53.1, reflecting major improvement in Hashimoto’s-related thyroid autoimmunity.
TPO Antibody
This Microsomal TPO Antibody chart shows a substantial reduction from 755 to 193, highlighting effective lowering of thyroid autoimmunity through supportive care.
TPO Antibody Reduction Example
This Anti-TPO antibody chart shows a remarkable drop from 1,091 to 53.1, reflecting major improvement in Hashimoto’s-related thyroid autoimmunity.
TPO
This graph shows a steady decrease in Anti-TPO (Thyroid Peroxidase) antibody levels — from 52.1 down to 24.6 — over the span of a year, reflecting reduced thyroid autoimmunity and improved immune regulation.
TPO_2
This graph illustrates a significant reduction in Microsomal TPO Antibody levels from 416 to 213 between October 2023 and October 2024. Although there was some fluctuation mid-year, the overall downward trend indicates progress in lowering thyroid autoimmunity.
Thyroglobulin Antibodies (TgAb)
TGB Antibody
This graph shows a steady decrease in thyroglobulin antibodies from 25.8 to 3.8, indicating improved autoimmune thyroid regulation.
TGB Antibody_2
This chart demonstrates a significant reduction in thyroglobulin antibodies, dropping from a spike of 47 to 4.1, reflecting improved autoimmune thyroid function.
TGB Antibody_3
This graph shows a gradual decline in thyroglobulin antibody levels from 5.1 to 2.7, indicating reduced thyroid autoimmunity but still above the reference maximum of 0.9.
TGB Antibody_4
This Anti-TPO antibody chart shows a remarkable drop from 1,091 to 53.1, reflecting major improvement in Hashimoto’s-related thyroid autoimmunity.
TGB Antibody_5
This graph shows a steady decline in Thyroglobulin Antibody levels from 129.5 to 46.7 over approximately 8 months, indicating a positive downward trend in autoimmune activity.
TGB Antibody_6
This graph shows a significant drop in Thyroglobulin Antibody levels from 129.5 to 34.1 over time, followed by stabilization, reflecting a strong and sustained improvement in autoimmune response.
Graves’ Disease Markers (TRAb, TSI)
trAB Antibody
This graph shows a steady decline in TRAb (TSH Receptor Antibody) levels from 8.45 to 5.42, indicating improvement in autoimmune thyroid activity.
TSI
This graph shows a significant reduction in TSI (Thyroid Stimulating Immunoglobulin) levels from 303 to 140, indicating improved control of thyroid-stimulating autoimmunity.
This graph shows a steady upward trend in progesterone levels, rising from 1.11 to 7.8 over several months — indicating significant improvement in hormonal balance and potential support for overall reproductive health.
Adrenal Conditions
Adrenal fatigue, high DHEA, stress-related hormonal imbalance
DHEA Reduction
This graph illustrates a gradual reduction in DHEA Sulfate levels from a peak of 323 down to 210 over time, reflecting a shift from above the optimal range to within or near the target zone.
Metabolic Conditions
Insulin resistance, pre-diabetes, weight gain, PCOS, high cholesterol
This graph shows a steady decrease in Hemoglobin A1c levels from 6.2 to 5.7 over seven months, reflecting improved blood sugar control approaching the optimal range.
Insulin
This graph shows a steady and significant decline in insulin levels—from a peak of 26.2 down to 10.1—reflecting a marked improvement in insulin sensitivity and overall metabolic regulation over the monitored period.
Inflammation & Immune Response (CRP / Antibodies)
Systemic or gut-related inflammation
CRP Lab Optimization
This graph shows a significant reduction in cardiac C-reactive protein (CRP) levels—from an initial high of 12.18 to 1.18—indicating a substantial decrease in systemic inflammation and improved cardiovascular risk profile over time.
hsCRP Example
This graph illustrates a consistent decline in high-sensitivity CRP levels—from a peak of 6.8 to 1.7—indicating a marked reduction in inflammation and improved cardiovascular health over time.
IBD LAB Optimization
This graph shows a steady decline in ASCA (IgG) levels, decreasing from 46.5 to 32.1 over five months, indicating reduced immune reactivity and potential improvement in inflammatory bowel disease activity.
Anti-Parietal Antibody
This graph illustrates a steady reduction in Anti-parietal Cell Antibody levels from 86.1 to 42.3 over two years, indicating a potential improvement in autoimmune gastric activity.
Cholesterol / Lipids
Cardiovascular and metabolic risk reduction
Lipid Panel
This graph shows a reduction in LDL cholesterol from a peak of 181 to 129, indicating improved lipid control over time.
Nutrient Repletion (Iron, Ferritin)
Tracking improvement in nutrient deficiencies
Ferritin
This graph shows a steady improvement in ferritin levels, rising from a deficient 8 to 94, indicating successful repletion of iron stores over time.Ferritin levels rose from critically low (8) to 94 in three months, indicating effective iron repletion and improved metabolic support.
Dr. Linda Khoshaba is the Leading Integrative Health and Hormone Doctor in Scottsdale, Arizona. She has extensive experience working in the field as a Hormone Specialist and Natural Endocrinologist.
Phone: 480-687-0054 Fax: 833-605-1101 Email: contact@nesaz.com Address: Suite A 109 7500 E. Pinnacle Peak Rd. Scottsdale, AZ 85255
Hours of Operation: Mon: 8:30 AM - 4:30 PM Tue: 8:30 AM - 4:30 PM Wed: 7:30 AM - 4:30 PM Thu: 8:30 AM - 4:30 PM Fri: 8:30 AM - 3:30 PM Sat-Sun: Closed
This Site may include a variety of features, such as health tips and videos, services provided at Natural Endocrinology Specialists™, our online Supplement store, NESAZ Programs, email, and patient portal services. DISCLAIMER: These statements have not been evaluated by the Food & Drug Administration. These programs and products are not intended to diagnose, treat, cure, or prevent any disease. The information contained herein is for informational purposes. Please be sure to consult your doctor before taking this or any other product/program. Consult your doctor for any health problems or before starting a new program.