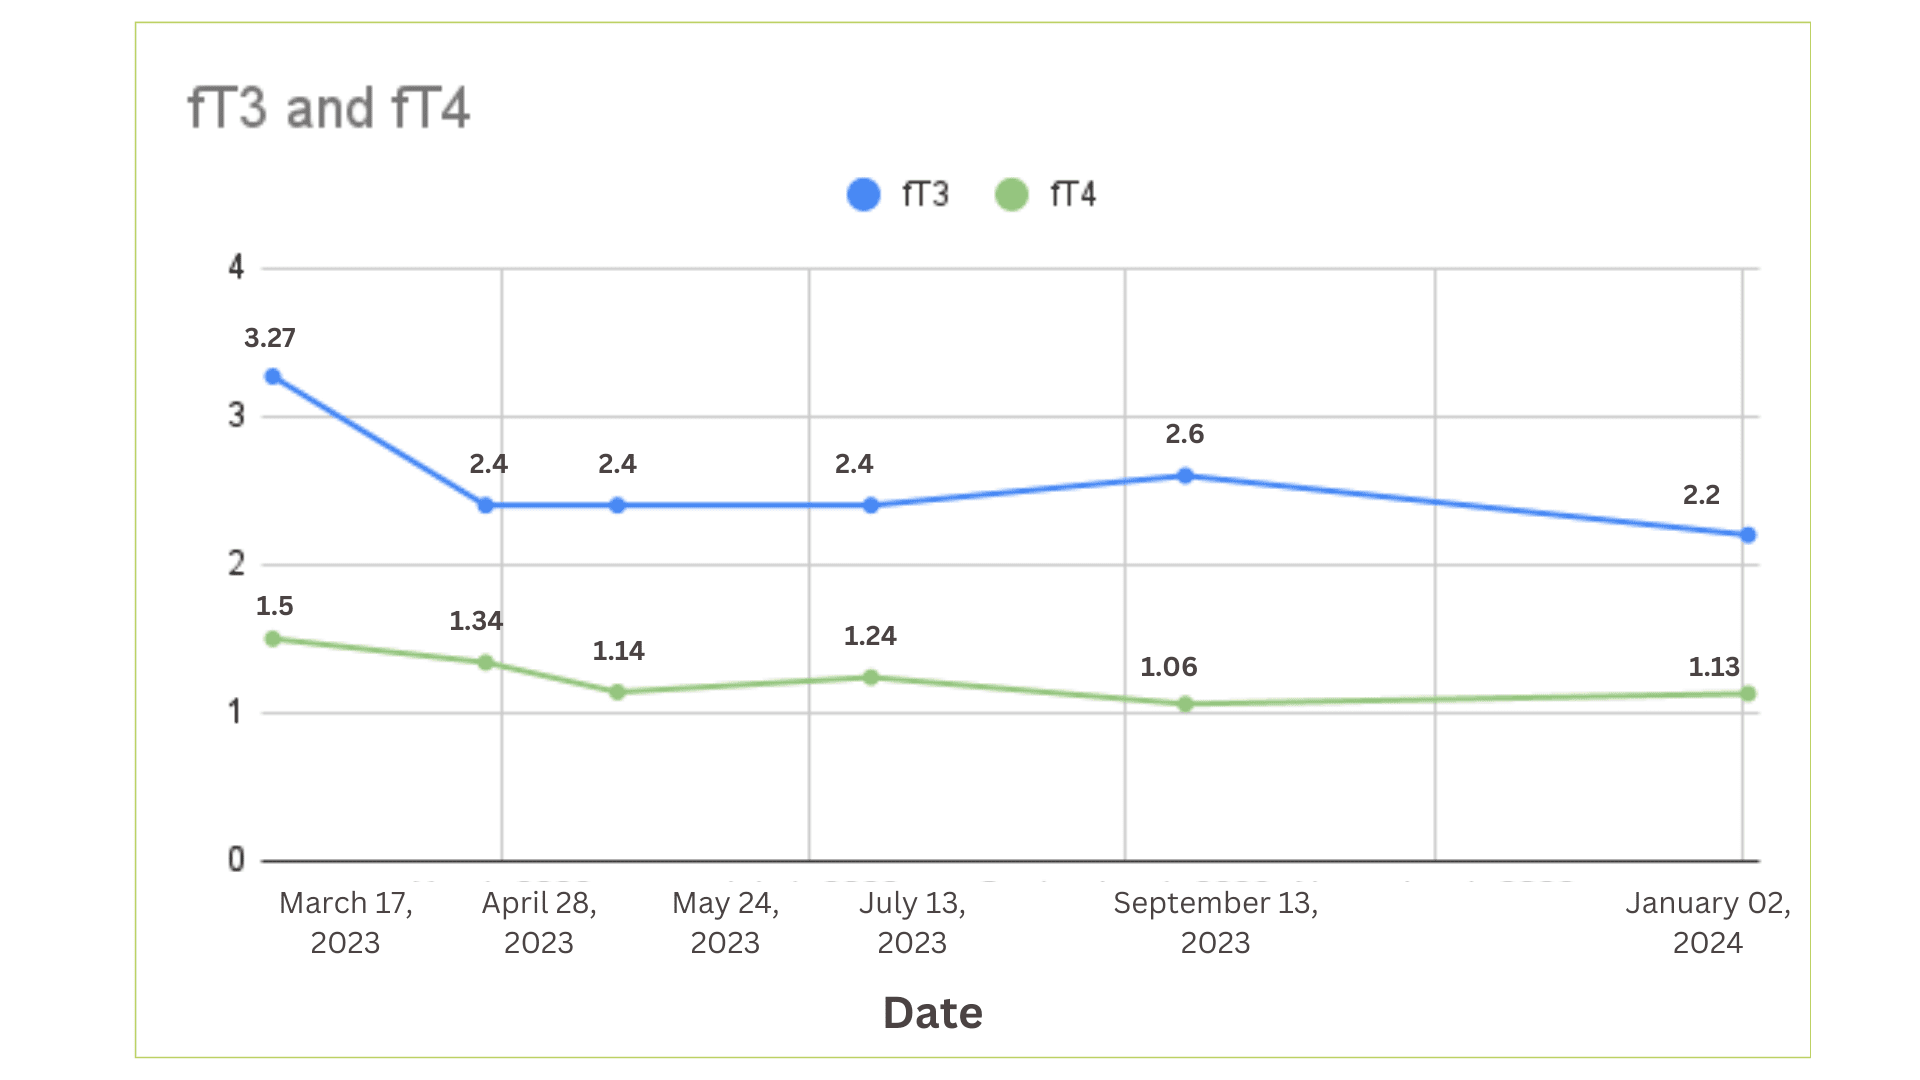
This graph is tracking two different thyroid hormones in the blood over several months. The blue line, which starts higher, represents fT3. It begins high, drops a bit, and then stays pretty level. The green line is fT4, which also drops at first, then holds steady. Ideally, both lines should be stable within a certain range, which would mean the thyroid is working as it should. The graph shows that after some changes, both hormone levels are mostly stable, which is a good sign.


